Introduction
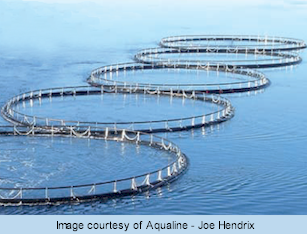
 With the growing worldwide demand for seafood, and the depletion of many fish stock in the natural environment, aquaculture has become a crucial source of protein and now accounts for nearly half of the worldwide supply of fish consumed by humans.
Concerns about the water column and benthic impact of fish farming require a thorough analysis of potential site locations for aquaculture operation that cannot be performed the old-fashioned way - by guessing and hoping for the best.
System Science Applications with the support of the NOAA Aquaculture Program, has expanded and improved the site evaluation tool AquaModel to include open ocean locations as potential sites for aquaculture.
AquaModel provides a scientifically based tool for site selection which allows evaluators to input site-specific data and simulate various options in order to minimize the impact on the environment and to maximize the health of the fish. The system is flexible in accepting a broad range of input data from very general seasonal parameters to any specificity level the user desires such as hourly observations of current velocity, direction, dissolved oxygen, nutrient content, etc.
Project Objectives
- Develop an interface between AquaModel and 3 dimensional costal circulation models.
- Develop a far-field version of AquaModel that will simulate the water column effects of multiple farms over large regions.
- Test the enhanced model in two regions where oceanographic conditions are well known but differ greatly.
- Conduct sensitivity analyses from the two sites of key parameters or unknowns considered most important.
Sites Evaluated
The sites selected to evaluate the model and to conduct sensitivity analysis are:- The San Diego Southern California Bight
- The University of New Hampshire Open Ocean Aquaculture Site in the Gulf of Ma
Details on these sites can be viewed by selecting the "Sites Evaluated" tab. Details about the flow models used in the analysis can be viewed by selecting the "Flow Models" tab.
Study Results
For both sites separate near-field and far-field model simulations were evaluated. The near-field simulation studied the effect of a single fish farm, while the far field case investigated the interaction between multiple farms to study whether a regional effect might be generated within the coastal waters with 8 large fish farms with results reported as follows:
Southern California Bight Study
A month long study of this region was conducted with a starting biomass of approximately 21,000 metric tons of fish in 8 farms positioned from north to south in the San Diego Countercurrent area of the Southern California Bight. Patterns of nitrogen, phytoplankton and zooplankton production were studied and compared to the current velocity and direction of flow in this area that is noted for a large number of offshore mesoscale (>10 km diameter) eddies (i.e., circular gyres). The extent of perturbation by nitrogen was limited to a small area around each farm, no more than a few kilometers away and at concentrations that were small (i.e., typically < 0.2 µM but ranging up to 0.5 µM) and in no case moving close to the shallow coastline areas.
UNH Gulf of Maine Open Open Aquaculture Study
At the this site, both the near and far-field simulations were run with both 12 and 24 cages per farm. Detailed data files of local conditions were entered from the extensive available datasets, and the model was set to simulate the growth of Atlantic salmon stocked at 200 grams with a stocking density of 0.6 kg/m3 commencing in April of the test year. Each cage had 112,500 fish with a total in the farm equal to 1,350,000 (estimated at 6,750 metric tons). The model was set to run for 14 months.
At the end of each simulation, the average weight of each fish in the 12- and 24-cage farm was 5.4 and 5.16 kg. The total biomass in the farm at harvest for the 12- and 24-cage farms was 7,290 and 13,932 metric tons, respectively.
Importance of Parameters in Determining Environmental Impact
In the case of benthic impact the key parameters are (not in order of importance):- Rate of particulate waste production by the farm
- Depth of the water column
- Current velocities
- Oxygen concentration in the waters immediately above the sediment surface and in the surface layer of the sediments
- Rate of output of dissolved inorganic nitrogen by the farm
- Horizontal eddy diffusivity
- Depth of surface mixed layer
- Nutrient concentration in ambient waters
- Growth and grazing rate of phytoplankton


